Kalman Navigation Strategy

Kalman Navigation Strategy

Kalman Navigation Strategy

Go Signals

Latest 5 Signals

  • Premium

    Get the latest signals in real time with an active premium subscription.

  • 200tS_btc_15_273

    15M
    SHORTx5
    $72,622.9$73,756.3+31.21%
    TP1$70,356TP2$69,222.6TP3$68,089.2
    CLOSED
  • 200tL_btc_15_568

    15M
    LONGx5
    $68,428.4$66,764.9+36.47%
    TP1$71,755.4TP2$73,418.9TP3$75,082.4
    CLOSED
  • 200tS_btc_15_272

    15M
    SHORTx5
    $68,300$69,079.6+22.83%
    TP1$66,740.7TP2$65,961.1TP3$65,181.5
    CLOSED
  • 200tL_btc_15_567

    15M
    LONGx5
    $64,380.2$63,337.6+32.39%
    TP1$66,465.4TP2$67,507.9TP3$68,550.4
    CLOSED
  • 200tL_btc_15_566

    15M
    LONGx5
    $65,060.1$62,868.2+50.54%
    TP1$69,443.9TP2$71,635.8TP3$73,827.7
    CLOSED

Stats

Overall

PnL+ Avg.

+20.41%

W/L Rate

58.4%

Win

66

Lose

47

Recent P/LOlder -> Latest

+9.37%+15.42%+10.18%+24.1%-6.02%+50.54%+32.39%+22.83%+36.47%+31.21%

Signal Frequency

Overall

8days / 1-signal

BTC logoBTCPerp

8days / 1-signal

Avg Position Hold

Overall

1 day 9 hours

BTC logoBTCPerp

1 day 9 hours

Latest Signal

3/5/2026, 1:45 AM (9 days ago)

Summary

Trend Break Sync Strategy is a trend-following system that combines trendline breakouts with HMA-Kahlman trend reversal signals to capture high-probability entry zones. By applying Kalman Filter–based noise reduction concepts originally used in aerospace engineering, the strategy filters market noise and tracks real trend movements more reliably, while volume confirmation and breakout scoring further improve signal quality.

Setup

Long/Shortx515M

Related Indicators

Hull Moving AverageAverage True RangeVolumePivot Points High LowAverage Directional Index

Background

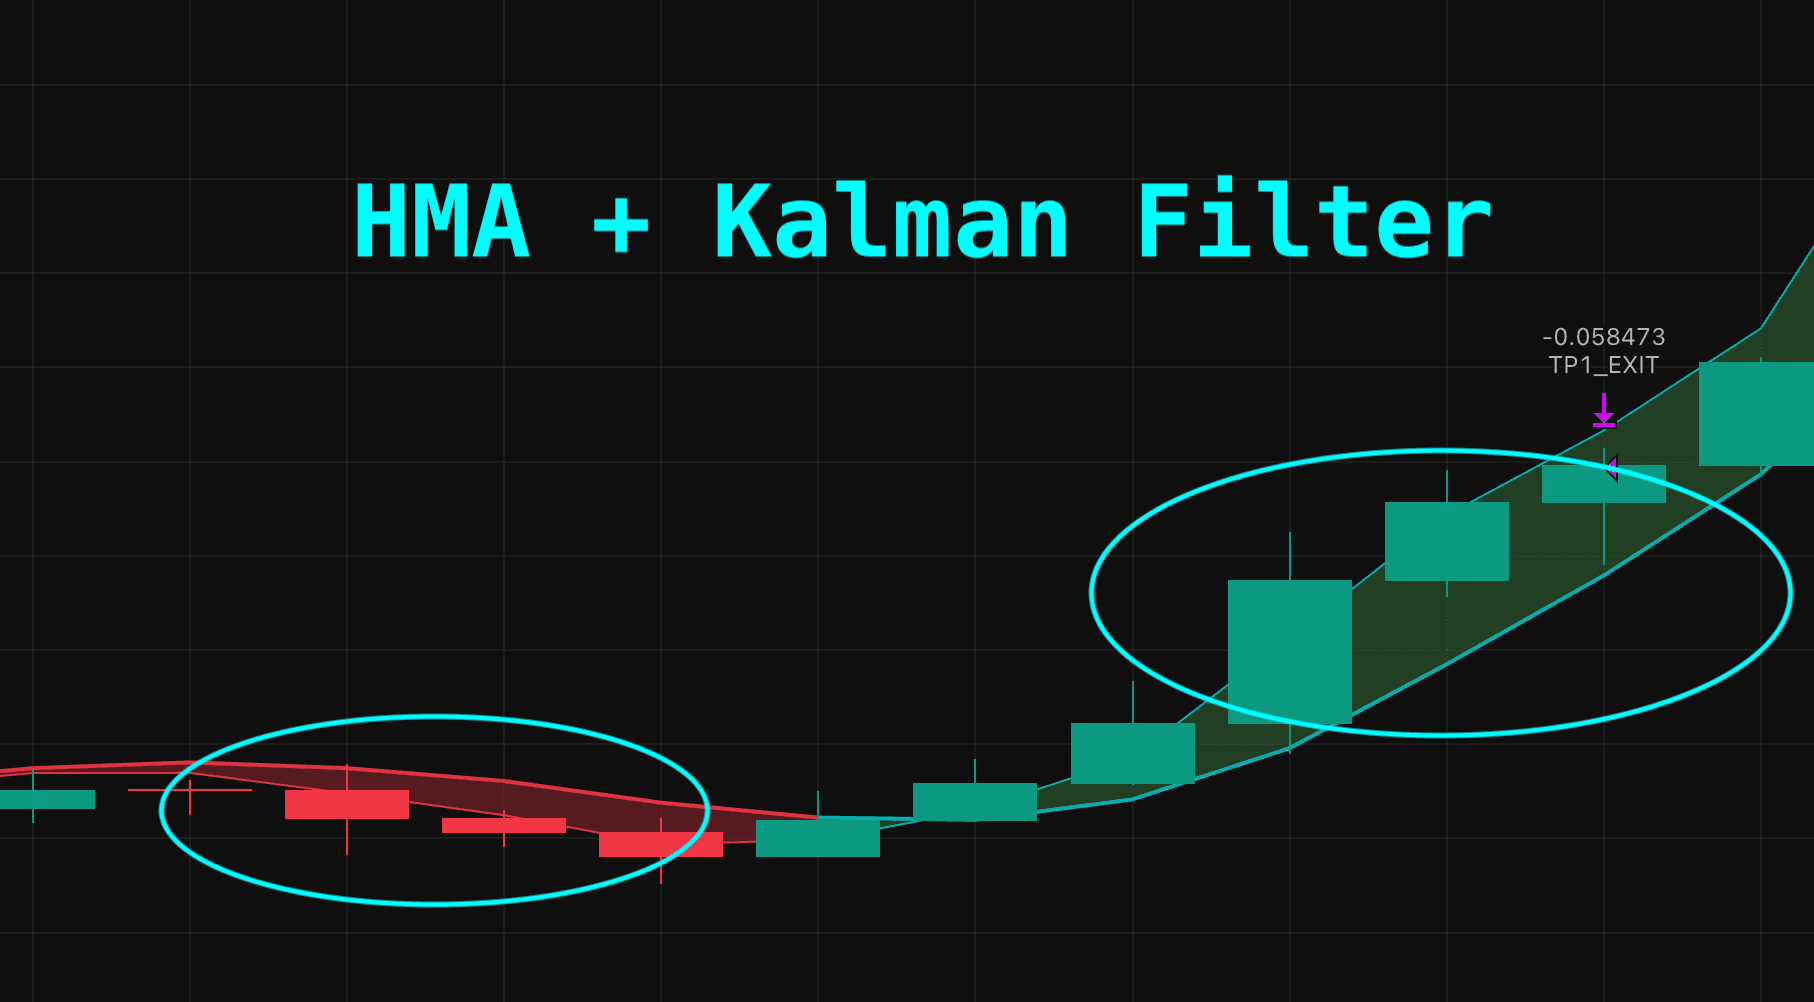
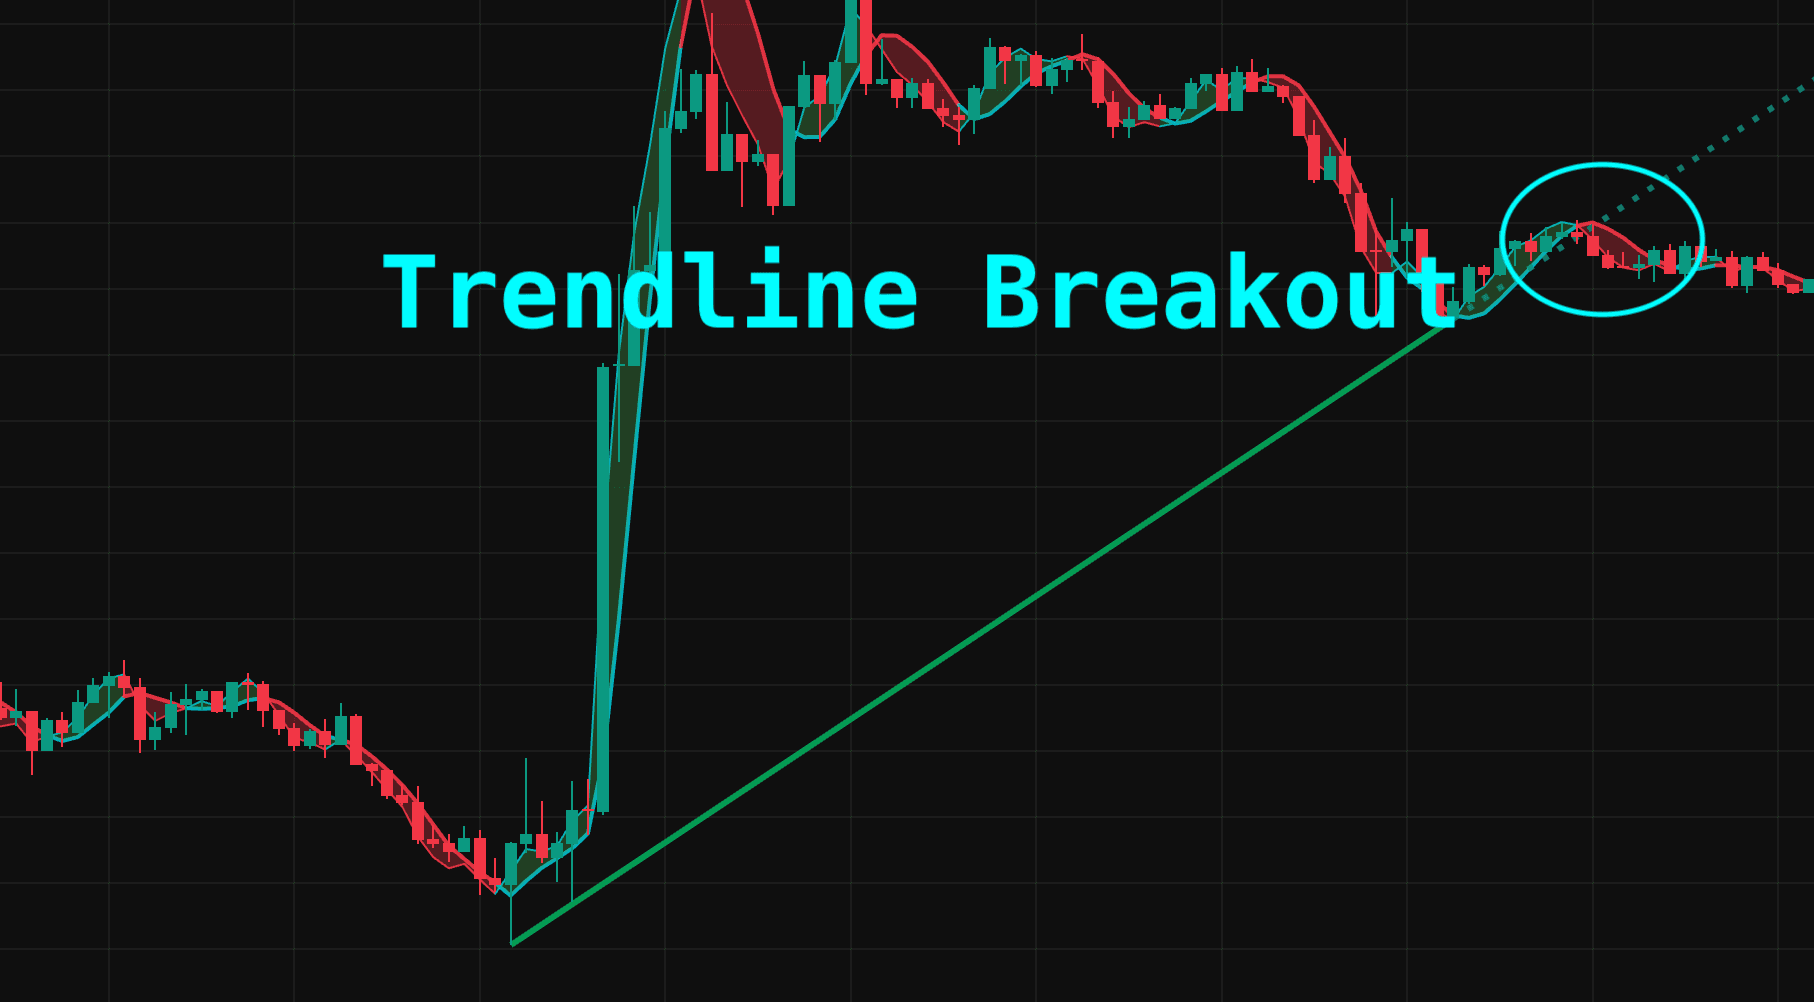
Trend Break Sync Strategy is a trend-following strategy inspired by Kalman Filter–based data filtering concepts used in aerospace and engineering fields. By synchronizing the cross of two smoothed lines (Line A & B) created from HMA (Hull Moving Average) combined with a Kalman filter with Trendline Breakouts, the strategy aims to capture high-probability entry points.

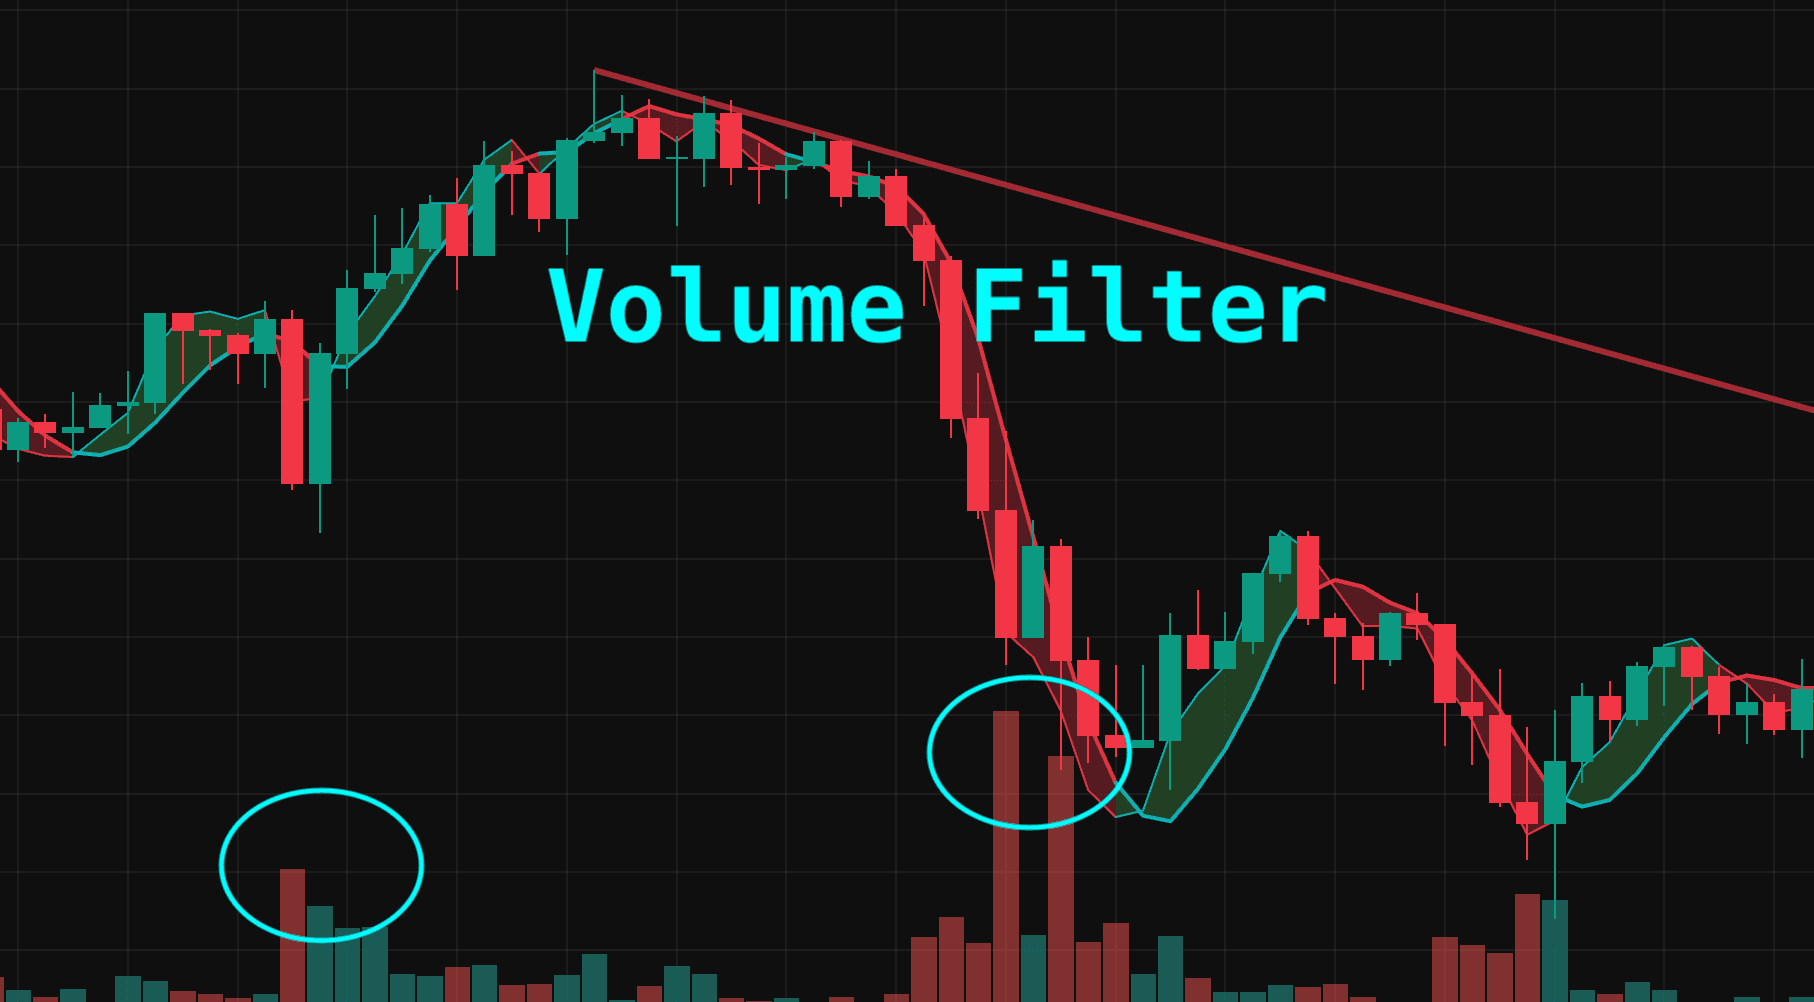
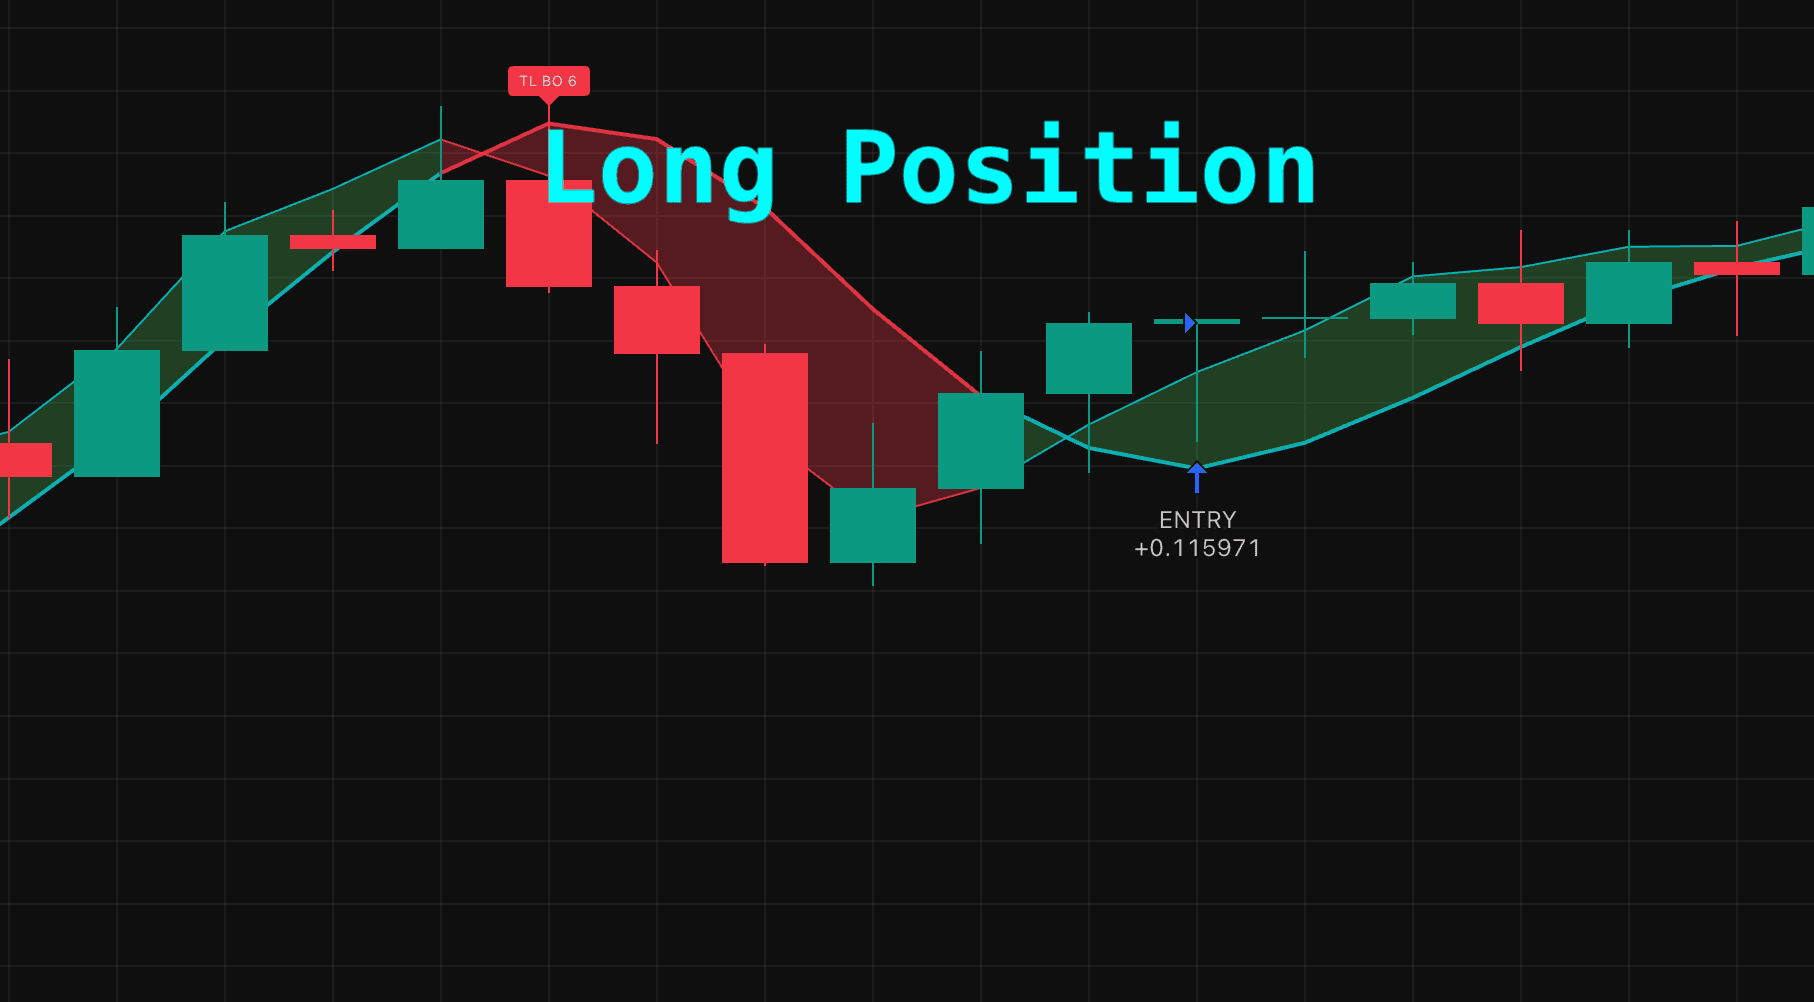
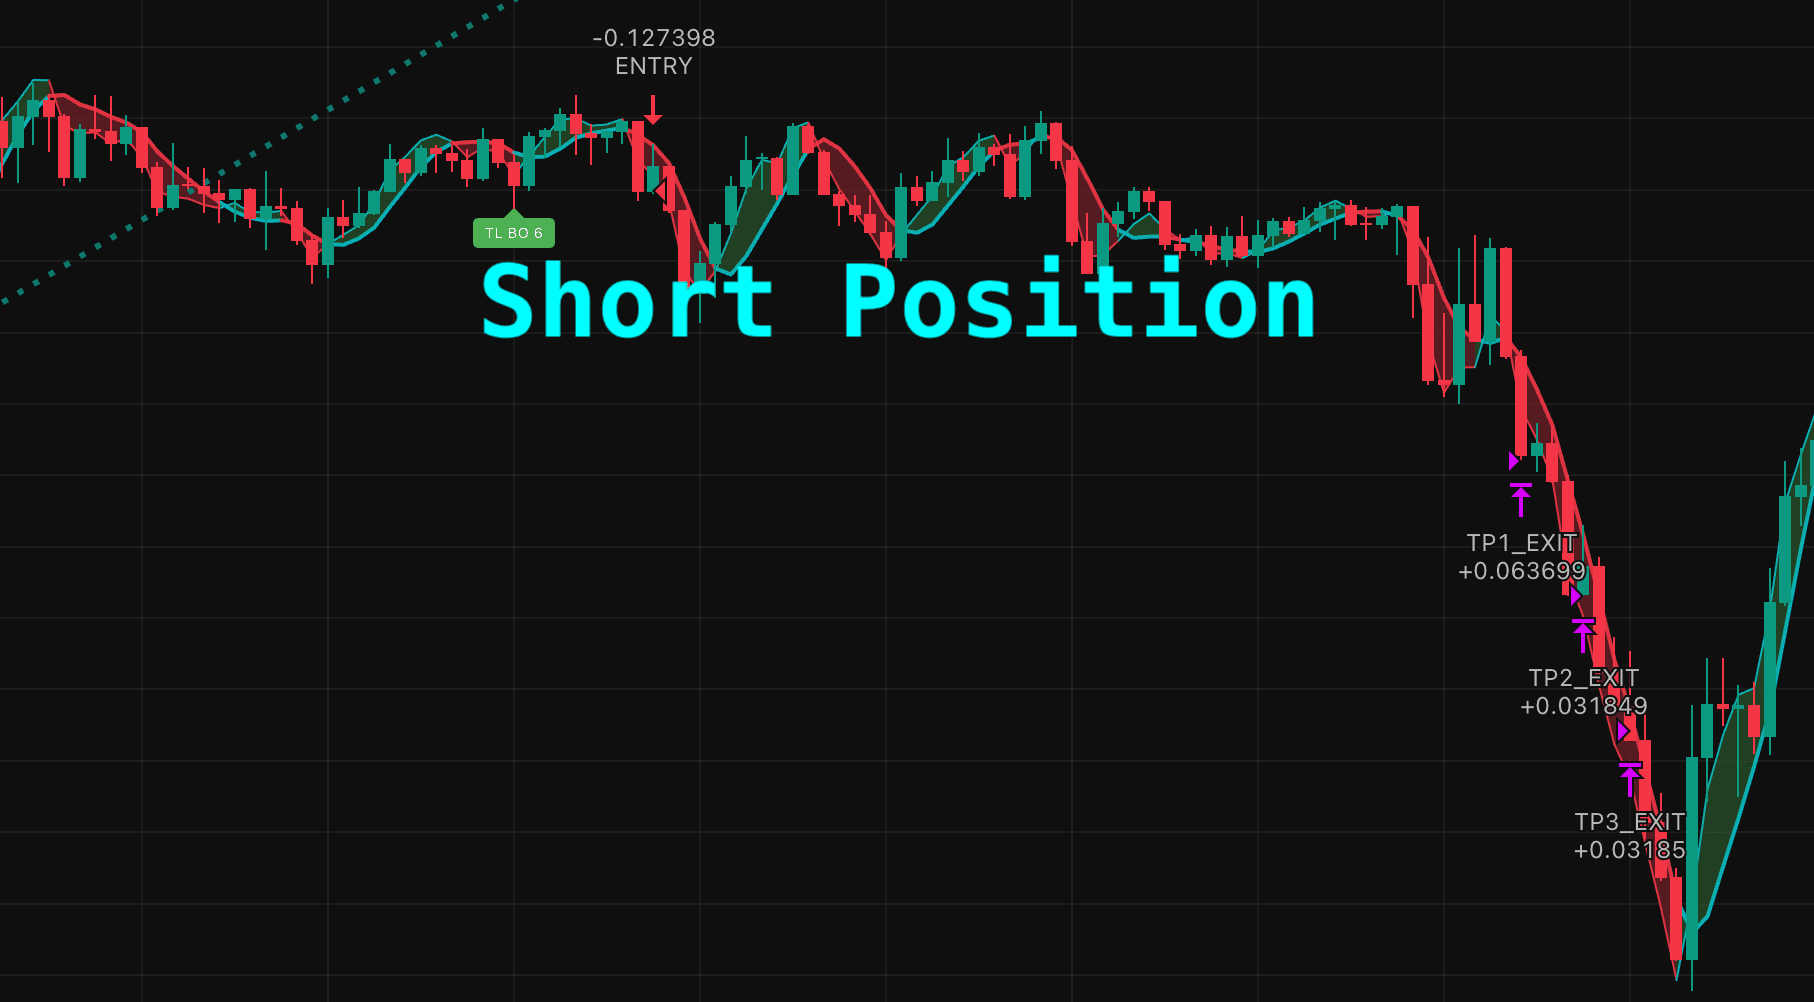
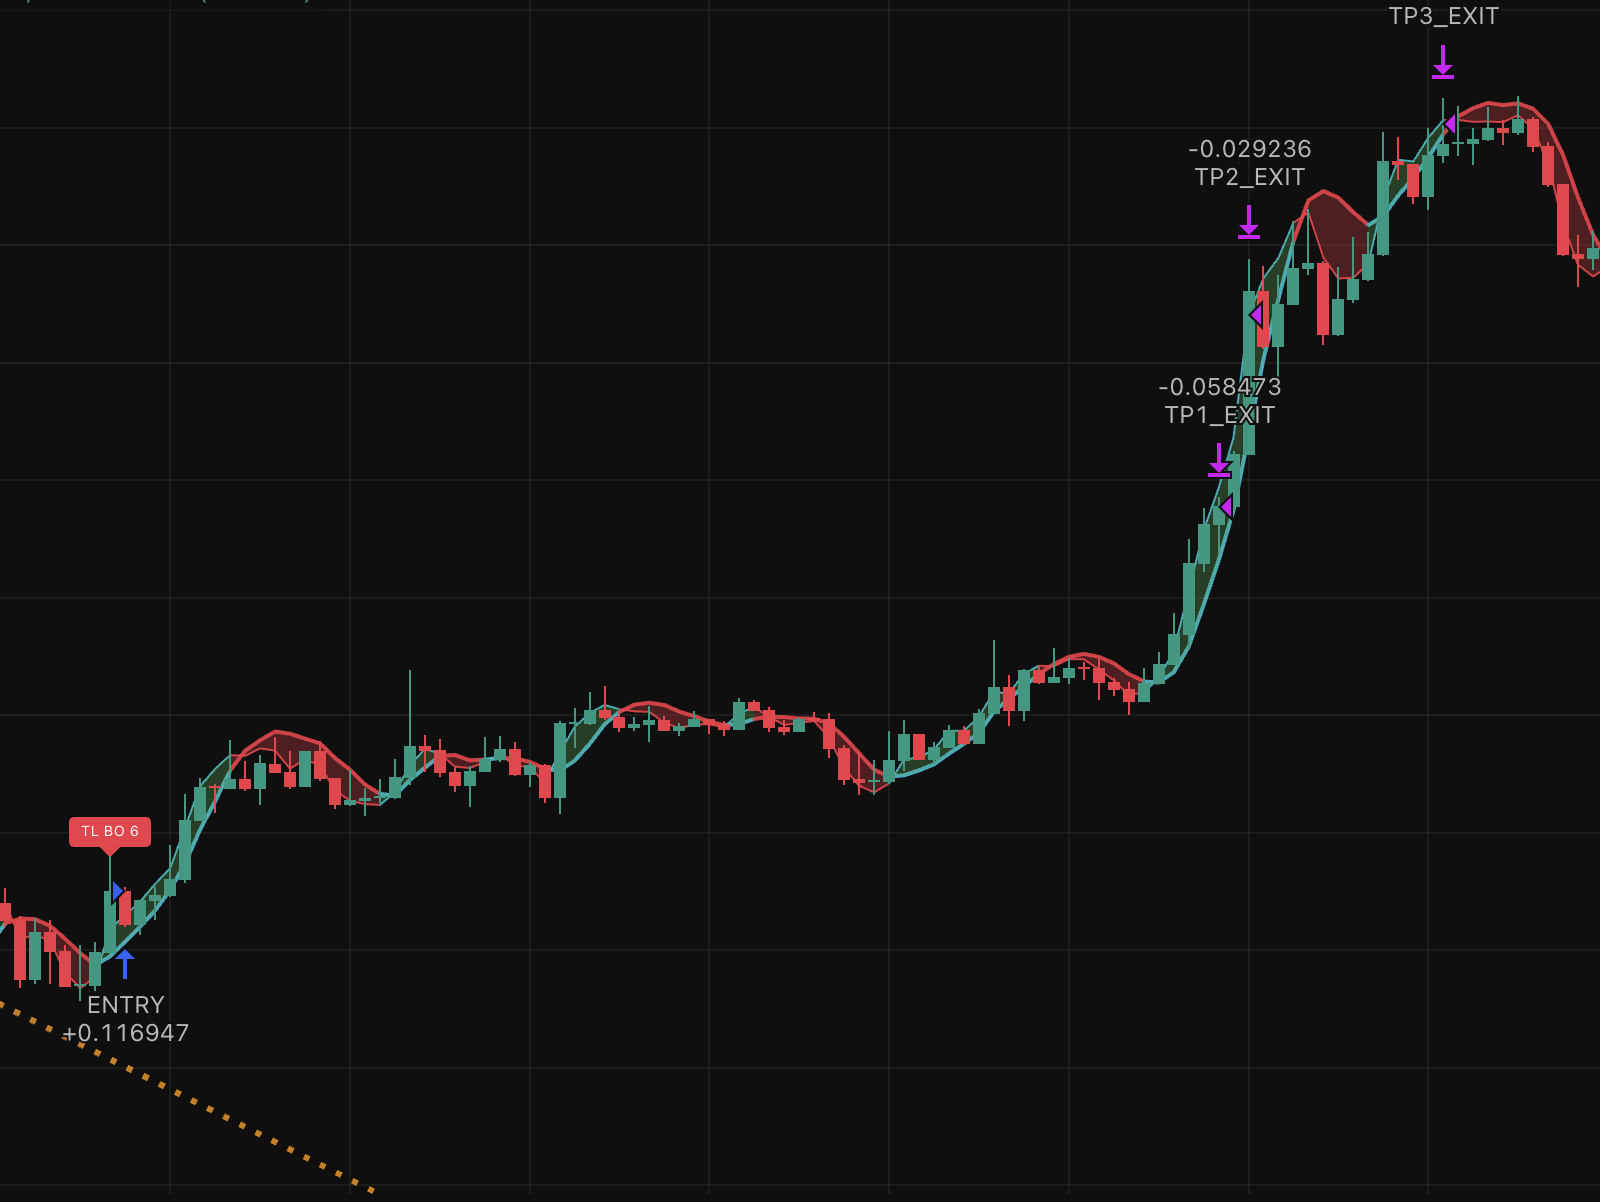
Rather than relying on a simple moving average crossover, this strategy integrates trend reversal signals, trendline breakouts, volume confirmation, and breakout strength scoring to reduce noise signals and enter only when a meaningful structural shift in the market is likely occurring.

The Kalman Filter is originally an algorithm used in aerospace and engineering to estimate real movement from noisy sensor data. By applying this concept to market data, the strategy filters out price noise and captures actual trend changes more reliably.

Backtest results show:

  • Average win rate: 55–60%
  • Average return per trade: around 20%

This demonstrates that the strategy performs efficiently by focusing entries on areas where trend reversals and structural breakouts occur simultaneously.

Key Features

The following are the core indicators used in this strategy.

HMA-Kahlman Trend

HMA with Kalman Filter

The first key indicator is the HMA-Kahlman Trend. This indicator helps visualize the overall direction of price movement (trend) in a faster and cleaner way. Compared to traditional moving averages, it responds faster to price changes while reducing unnecessary market noise, allowing traders to identify trend shifts more clearly.

Trendline Breakout

Trending Breakout
Trending Breakout

This indicator uses swing trendlines formed by connecting recent highs or lows. A breakout of this trendline suggests that the existing market structure may be breaking and a new directional move could begin.

Volume Surge Confirmation

Volume Filter
Volume Filter

This filter checks whether volume increases during price movement. Rising volume indicates that more market participants are actively involved in the move, which increases the reliability of the signal.

Entry Point

The actual entry conditions of this strategy are as follows.

The strategy does not enter trades based solely on moving average crosses. Instead, it first confirms a trendline breakout, and then waits for an HMA-Kahlman trend reversal signal before entering the position.

Long Entry

Kalman Navigation Strategy Long Position
  1. A downward trendline must exist, formed by the two most recent pivot highs.
  2. Price must break above this downward trendline.
  3. At the time of breakout, volume must be at least 20% higher than the 20-bar average.
  4. The Breakout Score evaluating breakout strength must be 3 or higher.
  5. The breakout must have occurred within the last 10 bars.
  6. Finally, a bullish crossover (crossUp) on the HMA-Kahlman indicator triggers the long entry.

Short Entry

Kalman Navigation Strategy Short Position
  1. An upward trendline must exist, formed by the two most recent pivot lows.
  2. Price must break below this upward trendline.
  3. At the time of the breakdown, volume must be at least 20% higher than the 20-bar average.
  4. The Breakout Score must be 3 or higher.
  5. The breakdown must have occurred within the last 10 bars.
  6. Finally, a bearish crossover (crossDn) on the HMA-Kahlman indicator triggers the short entry.

Core Concept Summary

The entry logic follows this sequence:

Trendline formation → Trendline breakout/breakdown → Volume confirmation → Breakout strength evaluation → Recent occurrence validation → Entry after HMA trend crossover

In other words, the strategy synchronizes market structure change (Trendline Break) with trend reversal signals (HMA Cross) and enters trades only when both conditions align.

Stoploss

Stop loss conditions are as follows.

ATR-Based Stop Loss

  • The stop loss is placed at Entry Price − ATR × Multiplier.
  • This creates a dynamic risk management system, where stop distance automatically adapts to market volatility.

Take Profit

The strategy uses a three-stage take-profit structure based on risk-reward ratios.

  • TP1: Risk × 2 → Close 50% of the position
  • TP2: Risk × 3 → Close 25% of the position
  • TP3: Risk × 4 → Close the remaining position

Additionally, once TP1 or TP2 is reached, it is recommended to move the stop loss to breakeven (Entry Price) or to TP1 in order to protect the initial capital.

FAQ

Q1. Which markets is this strategy suitable for?

This strategy is designed for futures markets and assets with strong volatility, particularly cryptocurrency markets, index futures, and other highly active instruments where structural breakouts tend to occur.

Q2. Which timeframe works best?

The strategy can be applied across multiple timeframes, but it generally performs most consistently on 15-minute to 1-hour charts. Very low timeframes (such as below 5 minutes) may introduce excessive noise.

Q3. Does this strategy generate signals frequently?

No. Because it requires trendline breakout + volume confirmation + trend reversal, signals occur less frequently. However, the strategy focuses on higher-probability setups rather than frequent trades.

Q4. Why use the HMA-Kahlman indicator?

HMA-Kahlman combines two techniques into a single trend indicator.

First, HMA (Hull Moving Average) is designed to reduce lag while reacting faster to price changes compared to traditional moving averages. Normally, smoother averages respond slower, while faster averages produce more noise. HMA attempts to balance these two factors.

By applying a Kalman Filter, additional noise reduction is achieved. The Kalman Filter is widely used in aerospace and engineering systems to estimate real movement from noisy data.

By combining:

  • HMA’s fast response speed, and
  • Kalman Filter’s noise reduction capability,

the indicator can detect real trend changes faster and more reliably.

Q5. What is Breakout Score?

Breakout Score evaluates the reliability of a breakout. It considers factors such as trend duration, volume expansion, candle strength, and trendline slope. Higher scores indicate stronger and more reliable breakout signals.

Cautions

1. No strategy guarantees profit

Although this strategy is designed based on statistical probabilities, not every signal will result in profit. Proper risk management and position sizing are essential.

2. Performance may decrease in ranging markets

Since this is a trend-based strategy, sideways markets may produce false breakouts.

3. High leverage increases risk

While the strategy can be used in futures markets, using leverage above 10x significantly increases both profit and loss potential. Always adjust leverage and position size according to your personal risk tolerance.